"One-time payment, own it forever" 10% off ! discount code -excl10

Overbought Oversold Indicator TradingView Tips
Learn how to use an overbought oversold indicator Trading View traders trust to spot reversals, filter noise, and time entries with more confidence.
3/21/20265 min read
Most traders don’t lose because they never find a signal. They lose because they react to every signal. That is exactly where an overbought oversold indicator TradingView users rely on can make a real difference. It gives you a fast read on when price may be stretched, when momentum is fading, and when a move is more likely to cool off than keep running.
The problem is simple. Newer traders often treat overbought as an automatic sell and oversold as an automatic buy. That sounds clean on paper, but live charts are messier. A strong trend can stay overbought for longer than expected. A weak market can stay oversold and keep sliding. If you want better entries, better filters, and fewer low-quality trades, you need to understand how to read these signals in context.
What an overbought oversold indicator TradingView setup really tells you
At its core, an overbought or oversold indicator measures how far price has pushed relative to a recent range, average, or momentum baseline. On TradingView, traders usually use tools like RSI, Stochastic, CCI, or custom channel-based indicators to visualize those zones.
When a market becomes overbought, it means price has moved hard to the upside and may be extended. When it becomes oversold, it means price has dropped sharply and may be stretched to the downside. That does not mean reversal is guaranteed. It means the odds of a pause, pullback, or reaction are rising.
That distinction matters. You are not getting a crystal ball. You are getting a probability tool. Used properly, it helps you stop chasing emotional moves and start reading when a market is getting crowded.
Why traders like these indicators on TradingView
TradingView is built for chart-based decision making, so overbought and oversold tools fit naturally into the workflow. You can layer them with structure, trend lines, support and resistance, volume, and alerts without turning your chart into a mess.
That flexibility is a big win for retail traders. If you trade Forex, crypto, or stocks, you need speed. You need signals you can read in seconds, not a system that takes ten indicators and fifteen minutes to interpret. A clean overbought oversold setup can help you scan faster, avoid late entries, and focus on areas where reaction is more likely.
It also helps traders who struggle with overtrading. If you already know your preferred market and timeframe, these zones create discipline. Instead of forcing trades in the middle of nowhere, you can wait for price to reach a meaningful area and then look for confirmation.
The biggest mistake traders make
The biggest mistake is trading the indicator by itself.
If RSI hits 70, many traders instantly look to short. If it drops below 30, they instantly look to buy. That approach gets punished in strong trends. A market with real momentum can keep climbing while the indicator flashes overbought again and again. The same is true in heavy selloffs.
The better approach is to ask a second question: what is price doing around that signal? If the market is overbought into a major resistance level, the setup is more interesting. If the market is oversold into support after a sharp flush, now you have context. Add a break of structure, candle confirmation, or a momentum shift, and the trade becomes much stronger.
This is where smart charting beats blind indicator use. The zone is the alert. Price action is the decision.
How to use overbought and oversold zones the right way
Start with trend direction. If the market is trending up, oversold signals often work better than overbought ones because they align with the larger move. In a downtrend, overbought pullbacks are often better short opportunities than oversold bounce attempts.
That one shift can improve trade quality fast. Instead of fighting the trend, you use the indicator to time pullbacks within it. That keeps you on the side of momentum rather than guessing tops and bottoms.
Next, pay attention to location. An oversold reading in the middle of a choppy range is not the same as an oversold reading right at a support zone. An overbought reading under a key resistance area carries more weight than one printed in open space.
Then look for confirmation. That might be a rejection wick, a bullish or bearish candle close, a break and retest, or agreement from a support and resistance tool. Confirmation helps filter weak signals and keeps you from jumping in too early.
Which indicator works best?
It depends on how you trade.
RSI is popular because it is simple and easy to read. It is a strong starting point for beginners and works well across multiple markets. Stochastic tends to react faster, which some day traders like, but it can also generate more noise. CCI can be useful for traders who want a different way to measure price extension. Custom overbought and oversold channel indicators can go a step further by showing more visual zones directly on the chart.
There is no perfect setting for every market. Crypto can move far more aggressively than many stocks. Forex often respects structure differently than small-cap equities. That is why customization matters. The best tool is not the one with the most features. It is the one you can read quickly and trust within your own strategy.
For many traders, that means using a cleaner all-in-one setup instead of stacking five separate oscillators. Too much information slows decisions and creates conflict. Strong trading tools should reduce hesitation, not create more of it.
What a stronger setup looks like in real trading
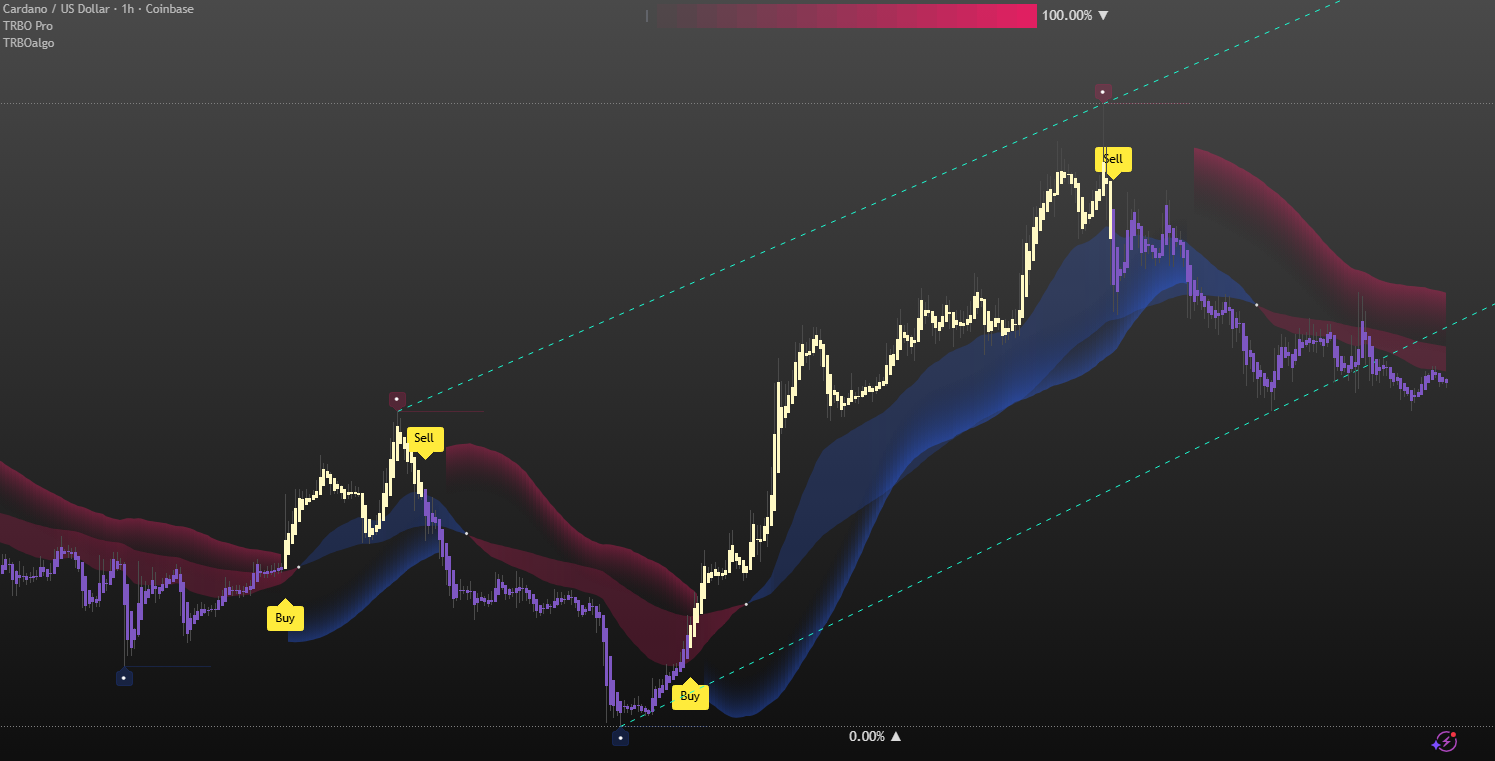
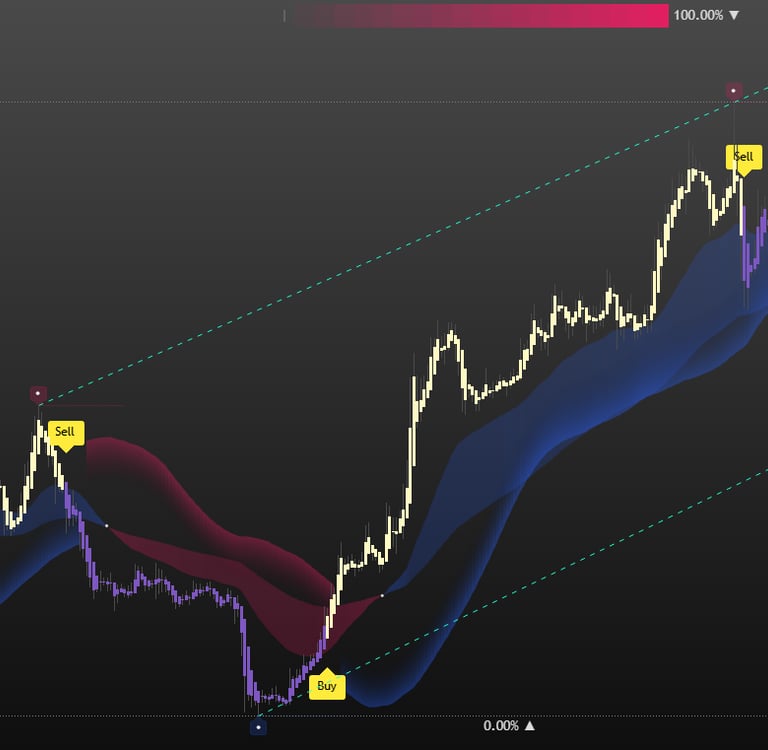
Imagine price is trending higher on the 1-hour chart. It pulls back into a clear support zone, and your overbought oversold indicator drops into oversold territory. That alone is not enough. But then price prints a strong rejection candle and closes back above support. Now you have trend, location, and confirmation working together.
That is a much better long setup than buying simply because an oscillator crossed a line.
Now flip it. Price is in a downtrend and rallies into resistance. Your indicator pushes into overbought territory, then momentum stalls and price rejects the level. That is not just an overbought reading. That is a pullback short with context.
This is how experienced traders use these tools. They do not ask, “Is the indicator red or green?” They ask, “Is this signal happening in a place where price is likely to react?”
Why non-repainting matters with overbought oversold tools
This point gets overlooked far too often. If your indicator repaints, your confidence gets wrecked. A signal looks great after the fact, but it was not actually there in real time the way you thought.
For traders trying to build consistency, that is a serious problem. You need tools that behave honestly on live charts. When you are evaluating overbought and oversold conditions, reliability matters just as much as sensitivity. Fast signals are great, but not if they disappear or shift after the candle closes.
That is one reason many traders move toward trader-built systems that combine overbought and oversold zones with entries, exits, and support structure in one place. A practical setup can save time and remove second-guessing. TRBOALGO is built around exactly that kind of chart efficiency, especially for traders who want a faster read without paying monthly subscription costs.
How beginners should keep it simple
If you are new, do not try to catch every reversal. Focus on one market, one timeframe, and one style of setup. Use the indicator as a filter, not as your entire strategy.
A strong beginner process is straightforward. First identify trend. Then mark support and resistance. Then wait for overbought or oversold conditions near those levels. After that, look for a clean confirmation candle or break of short-term structure.
That process will not catch every move. Good. It is not supposed to. It is supposed to help you avoid weak trades and act with more confidence when the chart lines up.
Patience is part of the edge here. The more selective you are, the more useful the indicator becomes.
Final thought
An overbought oversold indicator is not magic, but it can be a serious edge when you stop treating it like a shortcut. Read it with trend, structure, and confirmation, and it becomes more than a signal - it becomes a filter for better decisions. The goal is not to predict every turn. The goal is to spot cleaner opportunities faster and trade with less noise in your head.t content
Enhance your trading with our NON REPAINTED premium indicators !
© 2026. TRBO algo .All rights reserved.
DISCLAIMER:Trading carries significant risks and may not be suitable for all investors. Leveraged trading has the potential to magnify both gains and losses, making it crucial to comprehend the risks associated with trading on margin fully. The information provided by TRBO Algo is intended for informational purposes only and should not be considered as financial advice. We strongly advise seeking guidance from qualified financial professionals before making any investment decisions.It is essential to recognize that trading outcomes are not guaranteed and carry inherent risks. By using our products and services, you agree that TRBO Algo will not be liable for any losses or damages that result from your investment choices. This disclaimer serves to clarify that we do not make any assurances or guarantees regarding investment success or profitability. You acknowledge and assume full responsibility for all trading decisions you make.